Farm Datalogger
The demo can be used to Monitor critical parameters which decide the health of the crops, Display the data on a Dashboard using Grafana.
What will you need?
- Raspberry Pi 3/4 (or any variant of these)
- mcro-SD card and micro-SD card Reader/Adapter.
- Temperature, Pressure sensor - BME280
- Soil Moisture sensor
- Analog to Digital Converter - PCF8591 module
- OLED Display (128x64) (optional)
- Female to Female Du-point cables
- Laptop or Server Installed with Influxdb and Grafana
Steps
Make your own Farm datalogger following these steps.
- Install Shunya OS
- Write Code
- Connect Hardware
- Compile and Run
Step 1: Install Shunya OS
Shunya Interfaces is built on top of Shunya OS and comes pre-installed with Shunya Interfaces. Shunya OS is an linux-based OS that runs on your hardware, it light-weight and configurable.
Install Etcher
Etcher allows you to Flash Shunya OS on the micro-SD card.
- Windows
- Ubuntu
For Ubuntu 16.04
Installing Etcher is Simple, just run few commands in the terminal
Flash Shunya OS
- Download Shunya OS
- Right click on the downloaded zip file.
- Click Extract here.
- Open Etcher.
- Click Select Image.
- You will find the Shunya OS
.imgfile in the folder that we had extracted earlier. - Select
shunya-aaaa-image-xxxx.imgfile. - Insert SD card.
- Click on Flash.
This will load the micro-SD card with Shunya OS.
Booting Up with Shunya OS
- Insert the micro-SD card into the board.
- Connect peripherals like Keyboard, Mouse and HDMI monitor.
- Connect Power Supply.
The board should boot up with Shunya OS.
Login to Shunya
Login with these credentials:
- Username : shunya
- Password : shunya
Step 2: Lets code!
Open up your editor on Shunya OS and lets start coding.
Our application must be able to
- Read Temperature
- Read Pressure
- Read Soil Moisture
- Send it to Dashboard
- Repeat 1-4 after 10 minutes
Basic structure of Shunya Interfaces
Use the basic structure as a reference and Paste code into the structure as per your app logic.
- C/CPP
API for reading Temperature from the sensor is
- C/CPP
API for reading Pressure from the sensor is
- C/CPP
API for reading Soil moisture from the sensor is
- C/CPP
Send the Data to Dashboard
- C/CPP
warning
Summary
Your Code should look something like this.
- C/CPP
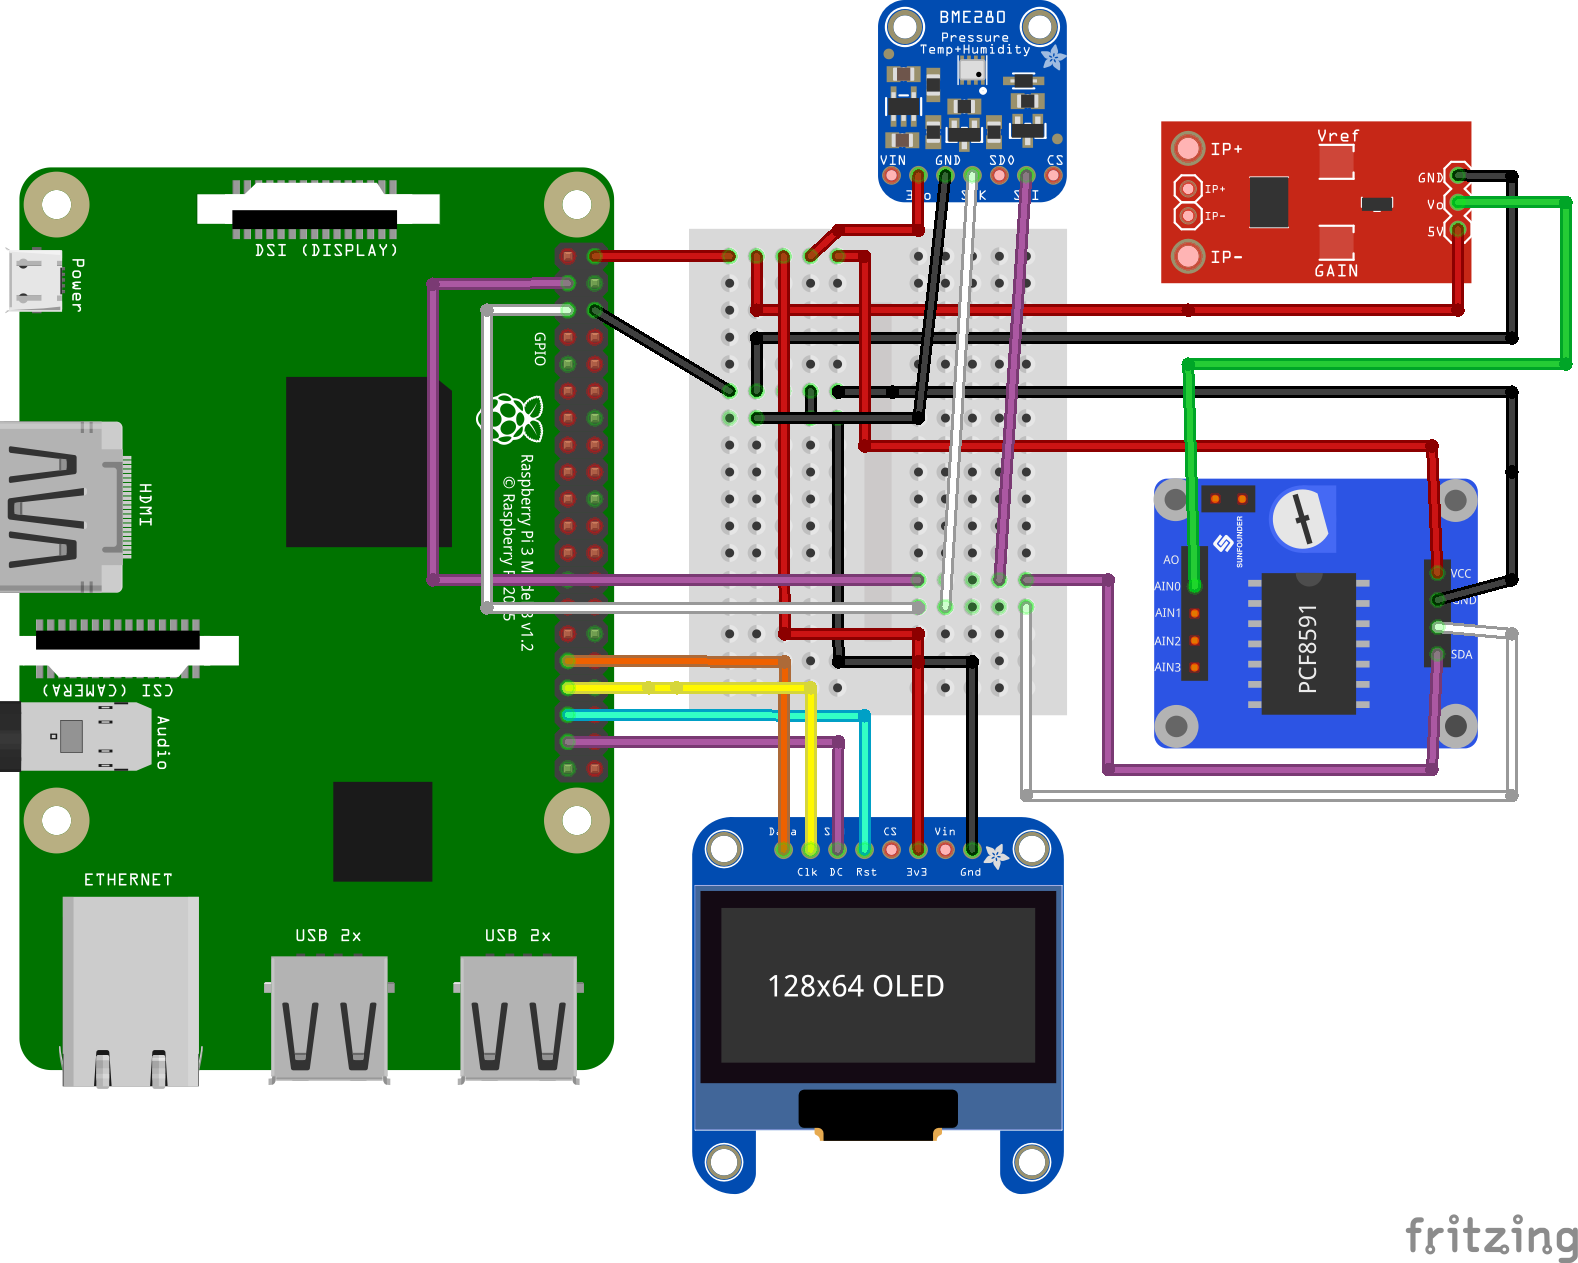
Step 3: Connect Hardware
Now its time to put all the hardware together, use the diagram below to connect hardware.
Step 4: Configure, Compile and Run
Configure
Tell Shunya Interfaces your hardware connections.
You can configure by running command.
Sensor ID's and Connection ID's
You tell all your Hardware connections to Shunya Interfaces via Sensor ID's and Connection ID's.
Each Sensor is given a special ID which the Shunya Interfaces library recognizes. And each Hardware pin on the Sensor is given a Connection ID.
So when we write pin 1: 1.1 Shunya Interfaces understands it as <Sensor 1>.<Sensor pin 1> connected to pin 1 of Raspberry Pi.
In our case, we have connected 2 devices to the Raspberry Pi (BME280 and PCF8591) to pin 3 (SDA) & pin 5 (SCL) respectively.
Our Config file will look like.
Make sure to save your changes to the config file.
Compile and Run
Compiling code is same as compiling C program. Just link the libraries.
tip
While running the code use sudo to give appropriate permissions to your app.
Now your IoT device is ready and publishing data to the server.
Step 5: Create Dashboards
Now that the IoT app is up and running, configure Grafana to create Beautiful Dashboards for you.
Grafana provides amazing guides for users to configure Grafana, take a look at them.
Want to Build your own Application?
Click on the Next button, below.